§2.1 Chapter 2 · Hard water
Water Hardness by District
Summary. Water hardness across inland North County ran from about 215 to 235 mg/L in 2025 for most taps, or roughly 12.6 to 13.7 grains per gallon.
Section 2.1 · revised · checked against district reports, code and agency pages · about 6 min to read
Supplier note: this section links to Quality Water Treatment, owned by the people who run North County Water & Pipes. Those links are labeled examples; no figure here depends on them. About these links
2.1.1 Which district has the hardest water?
By average, Fallbrook PUD at 235 mg/L, though Vista Irrigation District's range tops out higher, at 310. All five districts report very hard water for their main supply in 2025. The figures below come straight from each district's water quality report covering calendar 2025, even though the report titles carry different years.
| District | Average or range, mg/L | Grains per gallon | Main sources named in the report |
|---|---|---|---|
| Fallbrook PUD | 235 (200-270) | 13.7 | Lake Skinner imported water, Santa Margarita River, Capra Well |
| Rainbow Water | 230 (228-232) | 13.45 | Imported water treated at Skinner |
| Vista Irrigation District | 54-310 | 3.2-18.1 | Lake Henshaw, Colorado River, Northern California, Carlsbad desal |
| City of Escondido | 215 (210-230) | 12.6 by our math | Lake Henshaw and Lake Wohlford, imported water |
| Valley Center MWD | Reported by source only: Skinner 230, Carlsbad desal 60.5 | 13.5 and 3.5 by our conversion | Skinner, Twin Oaks plant with Carlsbad desal |
Fallbrook's figure is the system-wide average in FPUD's report. Rainbow's 230 mg/L comes from its 2025 Water Quality Report. Vista's spread is the widest because VID's report covers four very different sources, from Carlsbad desal at 61 mg/L to Skinner plant water at 230. Escondido's number is for finished water from the Escondido-Vista plant, in the city's 2025 report. Valley Center lists each source separately in its 2025 report with no blended average.
| Figure | What it is | Source |
|---|---|---|
| 235 mg/L | FPUD average hardness (13.7 grains per gallon) | FPUD consumer confidence report, 2025 data |
| 230 mg/L | Rainbow average hardness (13.45 grains per gallon) | Rainbow report on 2025 water |
| 54-310 mg/L | VID range across its four sources | VID consumer confidence report |
| 215 mg/L | Escondido plant effluent average | Escondido report on 2025 water |
| 17.1 mg/L | Equals one grain per gallon, as FPUD and Rainbow print it | USGS Water Science School; FPUD 2026 report; VID 2026 report |
| 180 mg/L | Above this, USGS calls water very hard | USGS Water Science School; FPUD 2026 report; VID 2026 report |
2.1.2 What do mg/L and grains per gallon mean?
They are two units for the same thing: dissolved calcium and magnesium, counted as calcium carbonate. Water reports use milligrams per liter (mg/L, the same as parts per million). Softener makers and test kits often use grains per gallon. To convert, divide mg/L by 17.1, the factor FPUD and Rainbow both print.
The USGS hardness scale puts names on the numbers: 0-60 mg/L soft, 61-120 moderately hard, 121-180 hard, and over 180 very hard. By that scale, a Fallbrook tap at 235 mg/L sits 55 mg/L above the very-hard line. Only Carlsbad desal water, at roughly 54-69 mg/L, falls into the soft or moderately hard range.
2.1.3 Why does hardness vary from week to week?
Because districts blend sources, and the sources differ. FPUD mixes imported Skinner water with local Santa Margarita River water, and its 2025 system readings ran from 200 to 270 mg/L around the 235 average. The blend and the reported range vary, so a single reading can differ from the annual average.
Vista shows the effect most clearly. VID says its 54-310 mg/L range depends on "source and flows," so a strip test in winter and another in summer may disagree. In Valley Center, the share of Carlsbad desal in the blend sets the number. Rainbow's supply is 100% imported Skinner water, which is why its range was only 228-232.
2.1.4 How can you test your own tap?
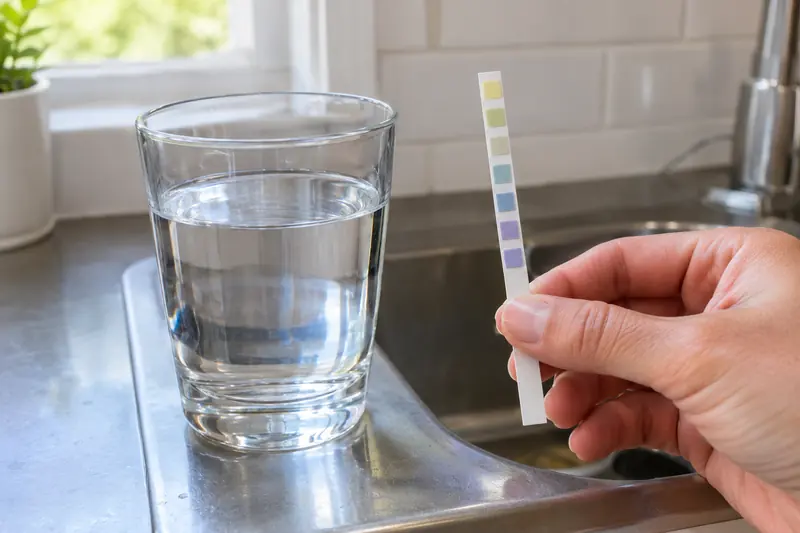
Use a hardness test strip or a drop-count kit on cold water from a kitchen tap, and read the result in grains or mg/L. A strip gives a color band; a titration kit counts drops until the color changes, which gives a finer reading. A field kit such as this hardness, iron and pH test kit (Quality Water Treatment, owned by the people who run North County Water & Pipes) also checks iron and pH from the same sample.
Test a few times across a season if you are in Vista or Valley Center, where blends shift. Compare your result with your district's report: a reading far below it after a softener means the softener is working, and a reading close to it means it is being bypassed or needs regeneration. Well owners should know that the County requires bacteria and nitrate testing by a qualified person, not a home kit, before a building or septic permit; see well water testing §7.3.
2.1.5 What does very hard water do at home?
It leaves scale wherever water is heated or evaporates. Per USGS, that heated-water scale can "reduce the life of equipment" and makes electric tanks less efficient and costlier to run. You see it first as white crust on aerators, showerheads and glass shower doors.
Water heater makers take it seriously. Rheem's manual says scale accumulates in the tank unless the supply is 0-5 grains, and builds faster at higher temperatures. At 13 to 14 grains, North County water is nearly three times that ceiling. What to do about it, from flushing to softening, is on scale and flushing §6.1 and water softeners §2.3.
2.1.6 Common questions
- Why does my test strip read lower than the district's average?
Strips read in broad color bands, so a result between two bands is a rough figure. A blend with more desal or river water that week can also pull your tap below the yearly average. A drop-count kit gives a closer number.
- Is 13.7 grains per gallon considered high?
Yes. It equals 235 mg/L, which is 55 mg/L above the USGS threshold for very hard water and well above the 0-5 grain range Rheem treats as soft.
- Where do I find my district's hardness number?
In the annual water quality report, usually in the table of secondary or unregulated constituents, listed as "Hardness" or "Hardness as CaCO3." Each district posts its report on its own website.
- Should I test hot or cold water?
Cold. The district reports measure water as delivered, before it reaches your heater, so a cold kitchen tap is the fair comparison with their figures.
- Does Escondido report hardness in grains?
No. The city's 2025 report gives hardness only in mg/L: an average of 215 with a range of 210-230. Dividing by 17.1 gives about 12.6 grains per gallon.
- Is Bonsall water as hard as Fallbrook's?
That depends on which district serves the parcel; the name on the water bill tells you. Compare your bill's district with the table above, or test the tap.
2.1.7 Sources for this section
Every hardness figure here was taken from a district's own report on 2025 water (Fallbrook, Rainbow, Vista, Escondido, Valley Center), alongside the USGS Water Science School and Rheem's use and care manual, read October 2026. Grain values for Escondido and Valley Center are our conversions at 17.1 mg/L per grain. Retailer and contractor claims about local hardness were left out, and no lab work was done for this page.
Checked October 29, 2026. Inline links in the text above go to each source.